Michael CorrellExploratory Data Analysis is Mostly Just Vibes, ManThis blog post accompanies a paper to be presented at CHI 2024, “Odds and Insights: Decision Quality in Visual Analytics” written by…12 min read·Mar 13, 2024--1--1
Michael CorrellThe Body Politic: A Sociopolitical Look at Anatomical VisualizationThis blog post accompanies a paper to be presented at CHI 2024, “When the Body Became Data: Historical Data Cultures and Anatomical…12 min read·Mar 4, 2024----
Michael CorrellThe Mythos of Visualization Literacy…writing is inferior to speech. For it is like a picture, which can give no answer to a question, and has only a deceitful likeness of a…20 min read·Feb 21, 2024----
Michael CorrellThe Othering of HCIWhat gets people into the field of computer science, keeps them there once they are in, and shows up in rosy predictions and imagined…15 min read·Oct 24, 2023--1--1
Michael CorrellRaining on Visual Statistics’ Parade?This blog post accompanies a paper to be presented at IEEE VIS 2023, “Fitting Bell Curves to Data Distributions using Visualization”…9 min read·Oct 23, 2023----
Michael CorrellAre Dashboards Rude?This blog post accompanies a paper to be presented at IEEE VIS 2023, “Heuristics for Supporting Cooperative Dashboard Design” written by…5 min read·Oct 18, 2023----
Michael Correll“We have visualization everywhere… we should be proud!”: A Trip Report from EuroVis 2023This post is my (perhaps vain) attempt to summarize what I got up at at the EuroVis 2023 conference in Leipzig, Germany. This conference…16 min read·Jul 25, 2023----
Michael CorrellWhat Makes Raincloud Plots Tick?This blog post accompanies a paper to be presented at EuroVis 2023, “Teru Teru Bōzu: Defensive Raincloud Plots.” For more details, read the…6 min read·Jun 2, 2023----
Michael CorrellVisualization Design Research: Catastrophizing, Collaborating, and CaringThis blog post accompanies a paper to be presented at CHI 2023, “Troubling Collaboration: Matters of Care for Visualization Design Study”…9 min read·Mar 7, 2023----
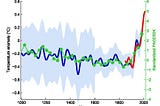
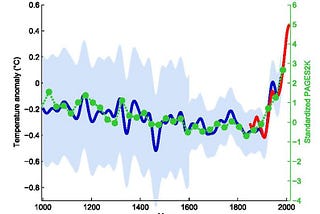
Michael CorrellAn Inconvenient GraphOr: How to Manipulate a Time Series if You Don’t Like What it Shows18 min read·Feb 22, 2023----